MEIER-AUDIO
CORDA
CORDA
FREQUENCY-ADAPTIVE FEEDBACK
THE FREQUENCY SPECTRUM OF SOUND PRESSURE
The human voice has a frequency range from down 100 Hz (Bass singing the low F at 87.3 Hz) upto around 1kHz (Soprano singing the high C3 at 1046 Hz). Although various musical instruments have a much wider range most (non-electronic) pieces of music stay within the frequency range of the voice as this is where human beings are used to express their feelings in a most natural way.
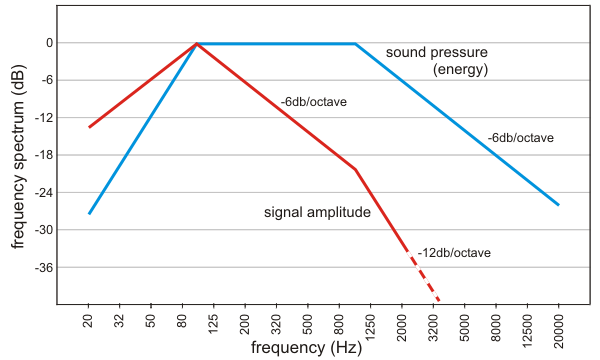
The blue line in the figure below roughly sketches the average frequency spectrum of soundpressure of acoustic/classical recordings. As can be expected the sound pressure is evenly distributed from 100 Hz up to 1 kHz.
For high frequencies most of the energy originates from the harmonics of the fundamental tones below 1 kHz and the energy/soundpressure drops with 6dB/octave.
For very low frequencies the wave lengths become very large (> 4 meters) which makes the mechanical coupling of acoustic instruments (which normally have a physical size much less than 4 meters) to the air very weak. As a result energy drops strongly.
One may think that an even energy distribution implies that the average amplitudes of the acoustic waves within the 100 Hz .. 1 kHz frequency range are also evenly distributed. However, such is not the case. At higher frequencies the air moves faster and thus contains more energy. An even energy distribution implies that the amplitudes of the acoustic waves decrease with 6dB/octave, as shown by the red line. Above 1 kHz the drop is even faster.
THE DIGITAL STORAGE OF SOUND
THE MECHANICAL STORAGE OF SOUND
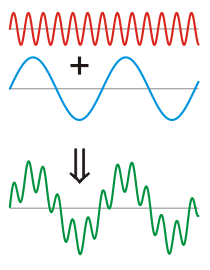
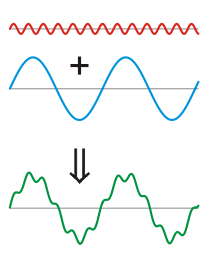
The picture to the left shows a high frequency sinus-signal (red line) and a low frequency sinus-signal (blue line) that both have the same acoustic energy. As explained above the high frequency signal has a much lower amplitude.
Summing both signals gives us the green line below. By eye it is easy to recognize the low frequency contribution. However, it is much more difficult to see what the high frequency contribution exactly looks like. It is "drowned" by the much larger pattern of the low frequency component.
The same would happen if this signal is stored to a mechanical sound carrier like the phonograph record (LP). The limited resolution of this medium and the low amplitudes of the high frequency components would result in a very poor rendition of these components.
To solve this problem the high frequency components are amplified before they are stored onto the LP. The green line at the right picture illustrates how this makes the high frequency components more "visible". At playback the amplitudes are electronically corrected to their normal levels.
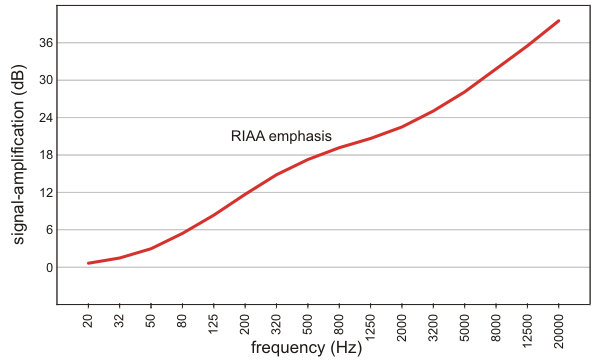
The red line in the figure below shows the amplification "correction" before a signal is banned onto an LP. The range in amplification factor is very large indeed. Between 50 Hz and 5 kHz the difference is 25 dB or a factor 18x!!
THE ELECTRONIC REPRODUCTION OF SOUND
The fundamental amplification element of a solid-state amplifier is the transistor. Unfortunately the transfer characteristics of a transistor are strongly non-linear and without additional measures the output signal of a transistor would be a strongly distorted version of the input signal.
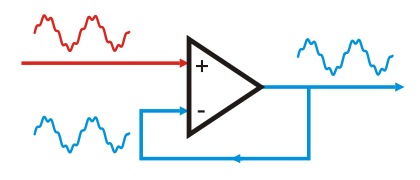
Therefore it is common use that the output signal of an amplifier is continously compared to its input signal and that the amplifier tries to make the difference between the two signals (apart from the amplification factor) as small as possible. This process is illustrated in the picture below.
Therefore it is common use that the output signal of an amplifier is continously compared to its input signal and that the amplifier tries to make the difference between the two signals (apart from the amplification factor) as small as possible. This process is illustrated in the picture below.
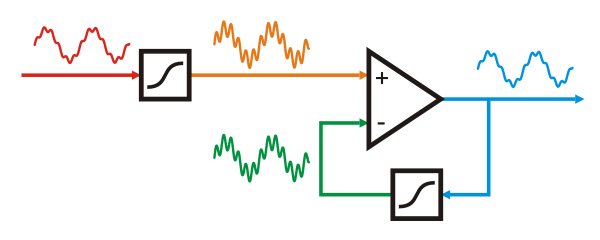
Similar to a phonograph record, the reproduction of high frequency signals by an amplifier can be made more accurate by changing the balance between the low frequency and the high frequency contents. This is illustrated in the figure to the right.
Both the input and the feedback signal are "reshaped" in exactly the same way by two equalization stages, thus emphasizing the high frequency components. This makes the comparison of the high-frequency signals at both inputs of the amplifier much easier.
Both the input and the feedback signal are "reshaped" in exactly the same way by two equalization stages, thus emphasizing the high frequency components. This makes the comparison of the high-frequency signals at both inputs of the amplifier much easier.
Frequency adaptive feedback improves the definition of the middle and upper frequencies. The sound becomes more fluent and better defined. Micro-detail is enhanced.
It should be noted that reshaping signals by the two additional processing blocks will add some distortion by themselves. However, this reshaping can be achieved using relatively simple electronic networks that contain resistors and capacitors only. These passive elements are much more linear and less noisy than any active amplification stage involving transistors. If high quality components are used, the distortion they produce is negligible compared to that of the amplification stage. The wins are much larger than the losses.
It should be noted that reshaping signals by the two additional processing blocks will add some distortion by themselves. However, this reshaping can be achieved using relatively simple electronic networks that contain resistors and capacitors only. These passive elements are much more linear and less noisy than any active amplification stage involving transistors. If high quality components are used, the distortion they produce is negligible compared to that of the amplification stage. The wins are much larger than the losses.
FREQUENCY-ADAPTIVE FEEDBACK
The 16-bit resolution of the CD is much higher than the mechanical resolution that can be achieved with a phonograph record. Unfortunately however the data are stored in a linear way. There is no "amplitude correction" of the high frequency components before storage.
As a result the effective resolution at the high frequencies is much lower than 16-bit. The amplitude of a 5 kHz signal is easily 100 times smaller than a bas tone that is present at 100 Hz. We thus "loose" 6..7 bit of resolution!
There is a reason why 24-bit recordings do sound better than 16-bit recordings. High frequency components are much better represented!!
The amplifier has a non-inverting input where the input signal is applied (+ input). At the second, inverting input, the output signal is applied (- input). Making the two signals equal implies:
+ Vin - Vout = 0
The technique of comparing the output signal to the input signal is called "electronic feedback". Unfortunately it can not be made perfect. It simply is not possible to make both signals exactly equal. The output signal will always be slightly distorted, but this distortion is much smaller as it would be without any feedback.
The circuitry that compares both the input and the feedback signals, like a storage medium, does have a limited resolution. Thus again the lower frequency signals will be more easily reproduced than the high frequency signals. Distortion of low frequency signals that have large amplitudes is lower than the distortion of high frequency signals with small amplitudes.